A digital stock market chart displaying red and green candlesticks with multiple moving averages in different colors on a black background.

Maximize Your

Trading Potential

a notion based template for active traders

journal. tag. track. analyze. improve

A digital financial calendar for November 2025 showing daily profit and loss figures, with green and red dots indicating positive or negative performance for each day.
Line graph titled 'Equity Curve' showing data from 2025 to 2026. The graph includes multiple points with values ranging from -$219 to $1,414, with different lines for Nov 2025 and Dec 2025 curves.
Trading journal dashboard displaying stock charts and trade records from January 6, 2026, including trades labeled 'Oklo Consolidation Breakdown,' 'Tesla Bounce,' 'Tesla Bounce Trade,' and 'MU Opening Drive Stuff,' with profit/loss details.

Featured Products

The Trading Desk Pro - Comprehensive journaling and tracking suite for active traders.
$19.99

A professional level trading platform designed by a professional equities and options trader. This is a comprehensive journaling tool that tracks all of your key metrics, broken into several categories including tickers & traits, strategies, vix regime, trade ratings and more.
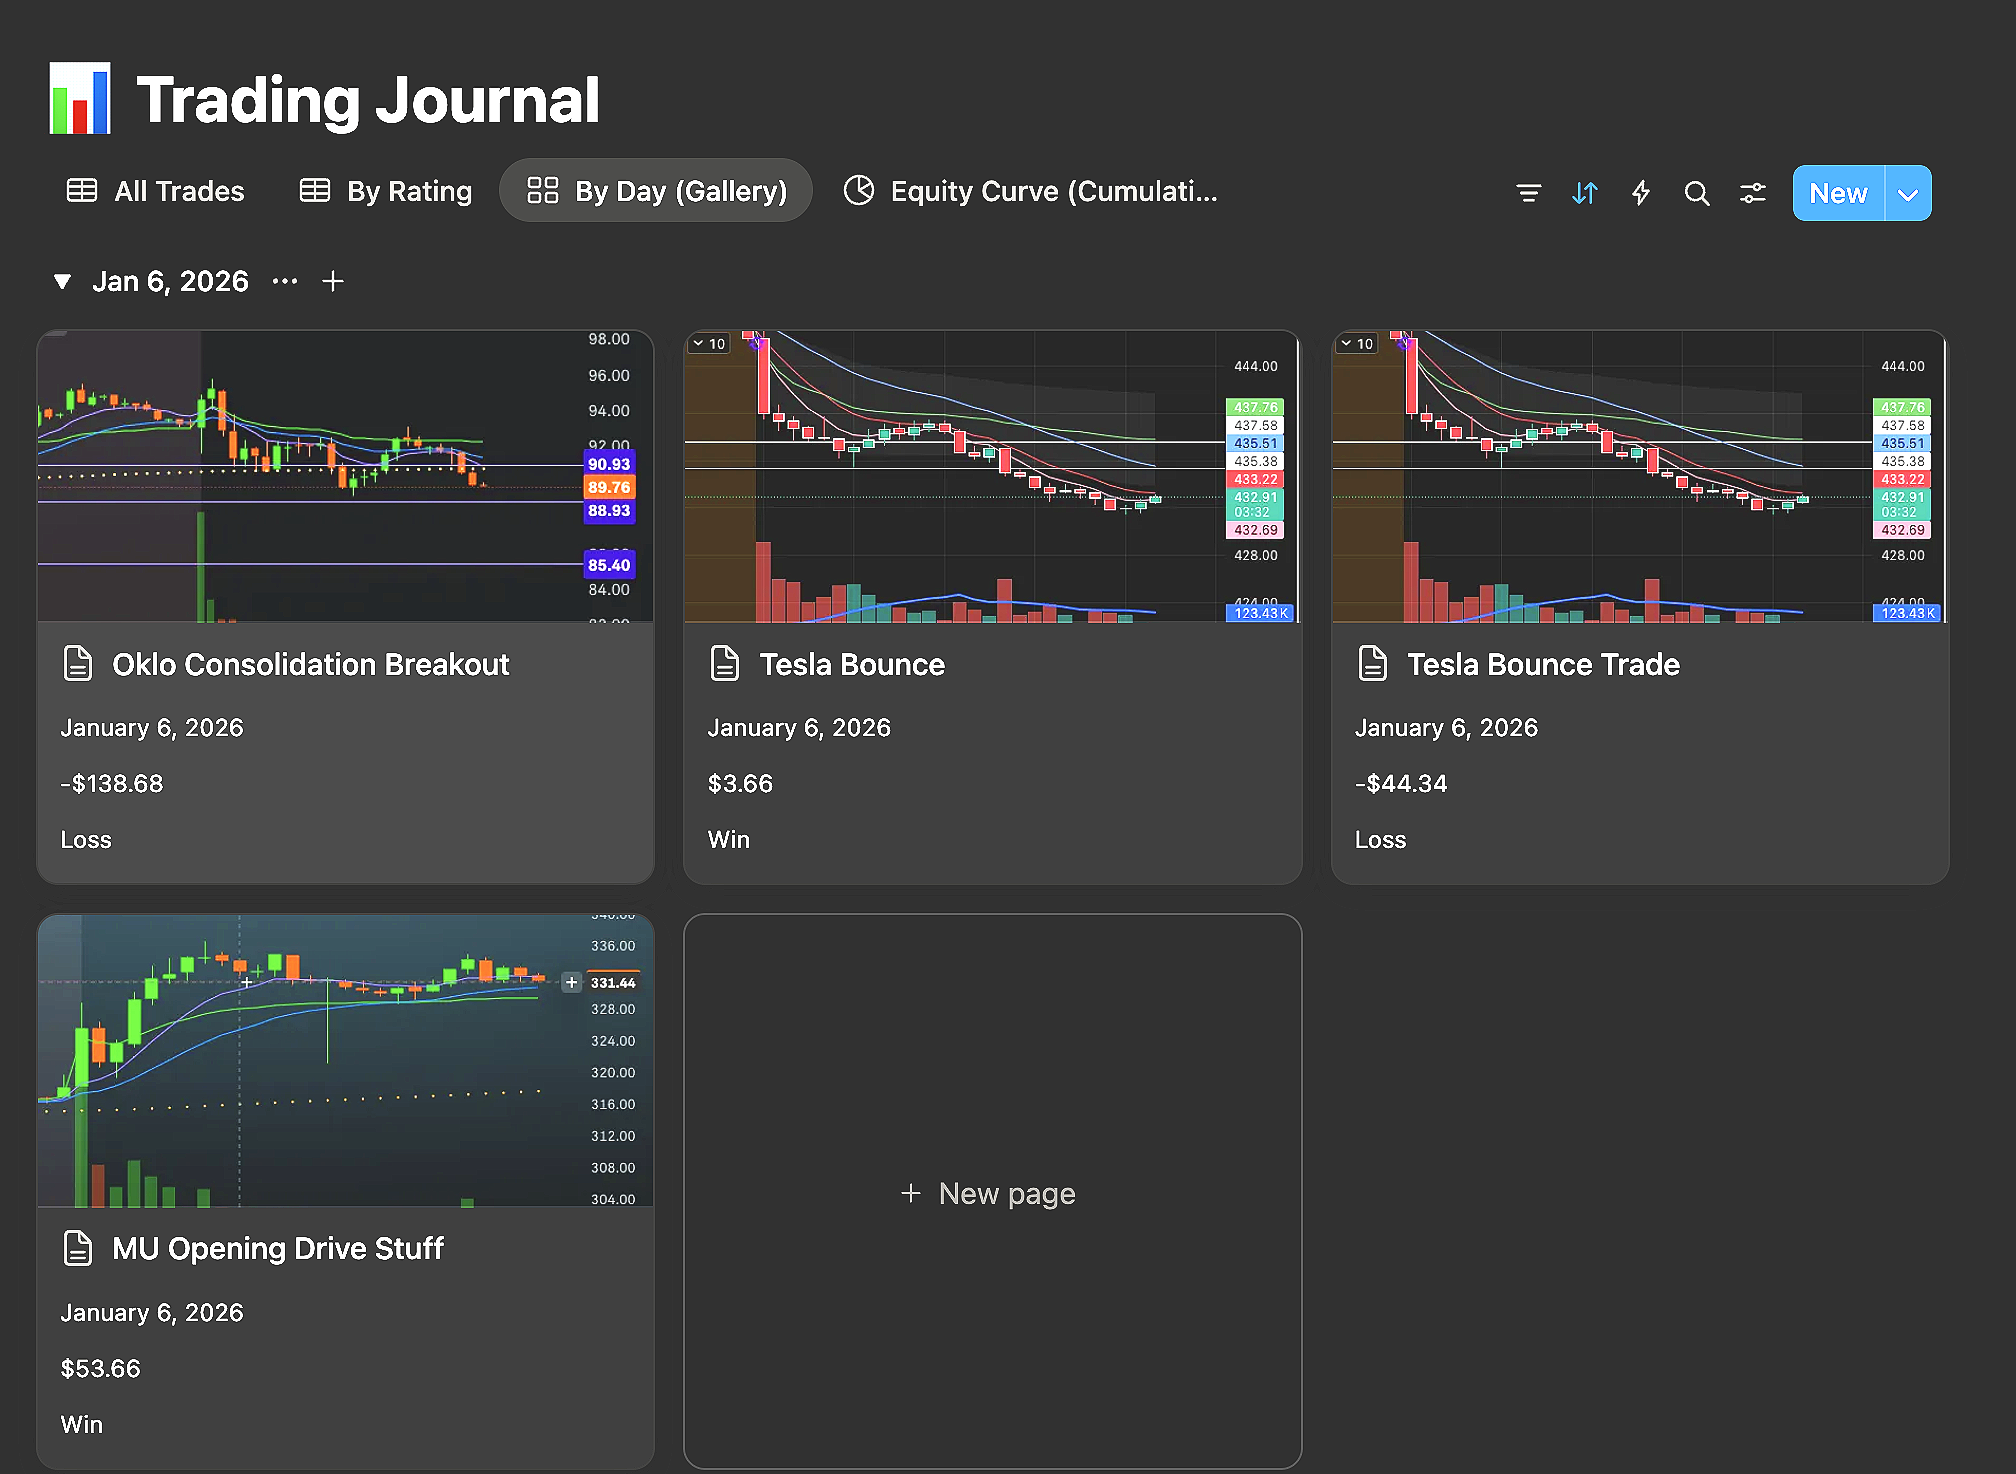
Trade Journaling

Ticker Tagging

Strategy Tagging

Vix Regime Tagging

Catalyst Tagging

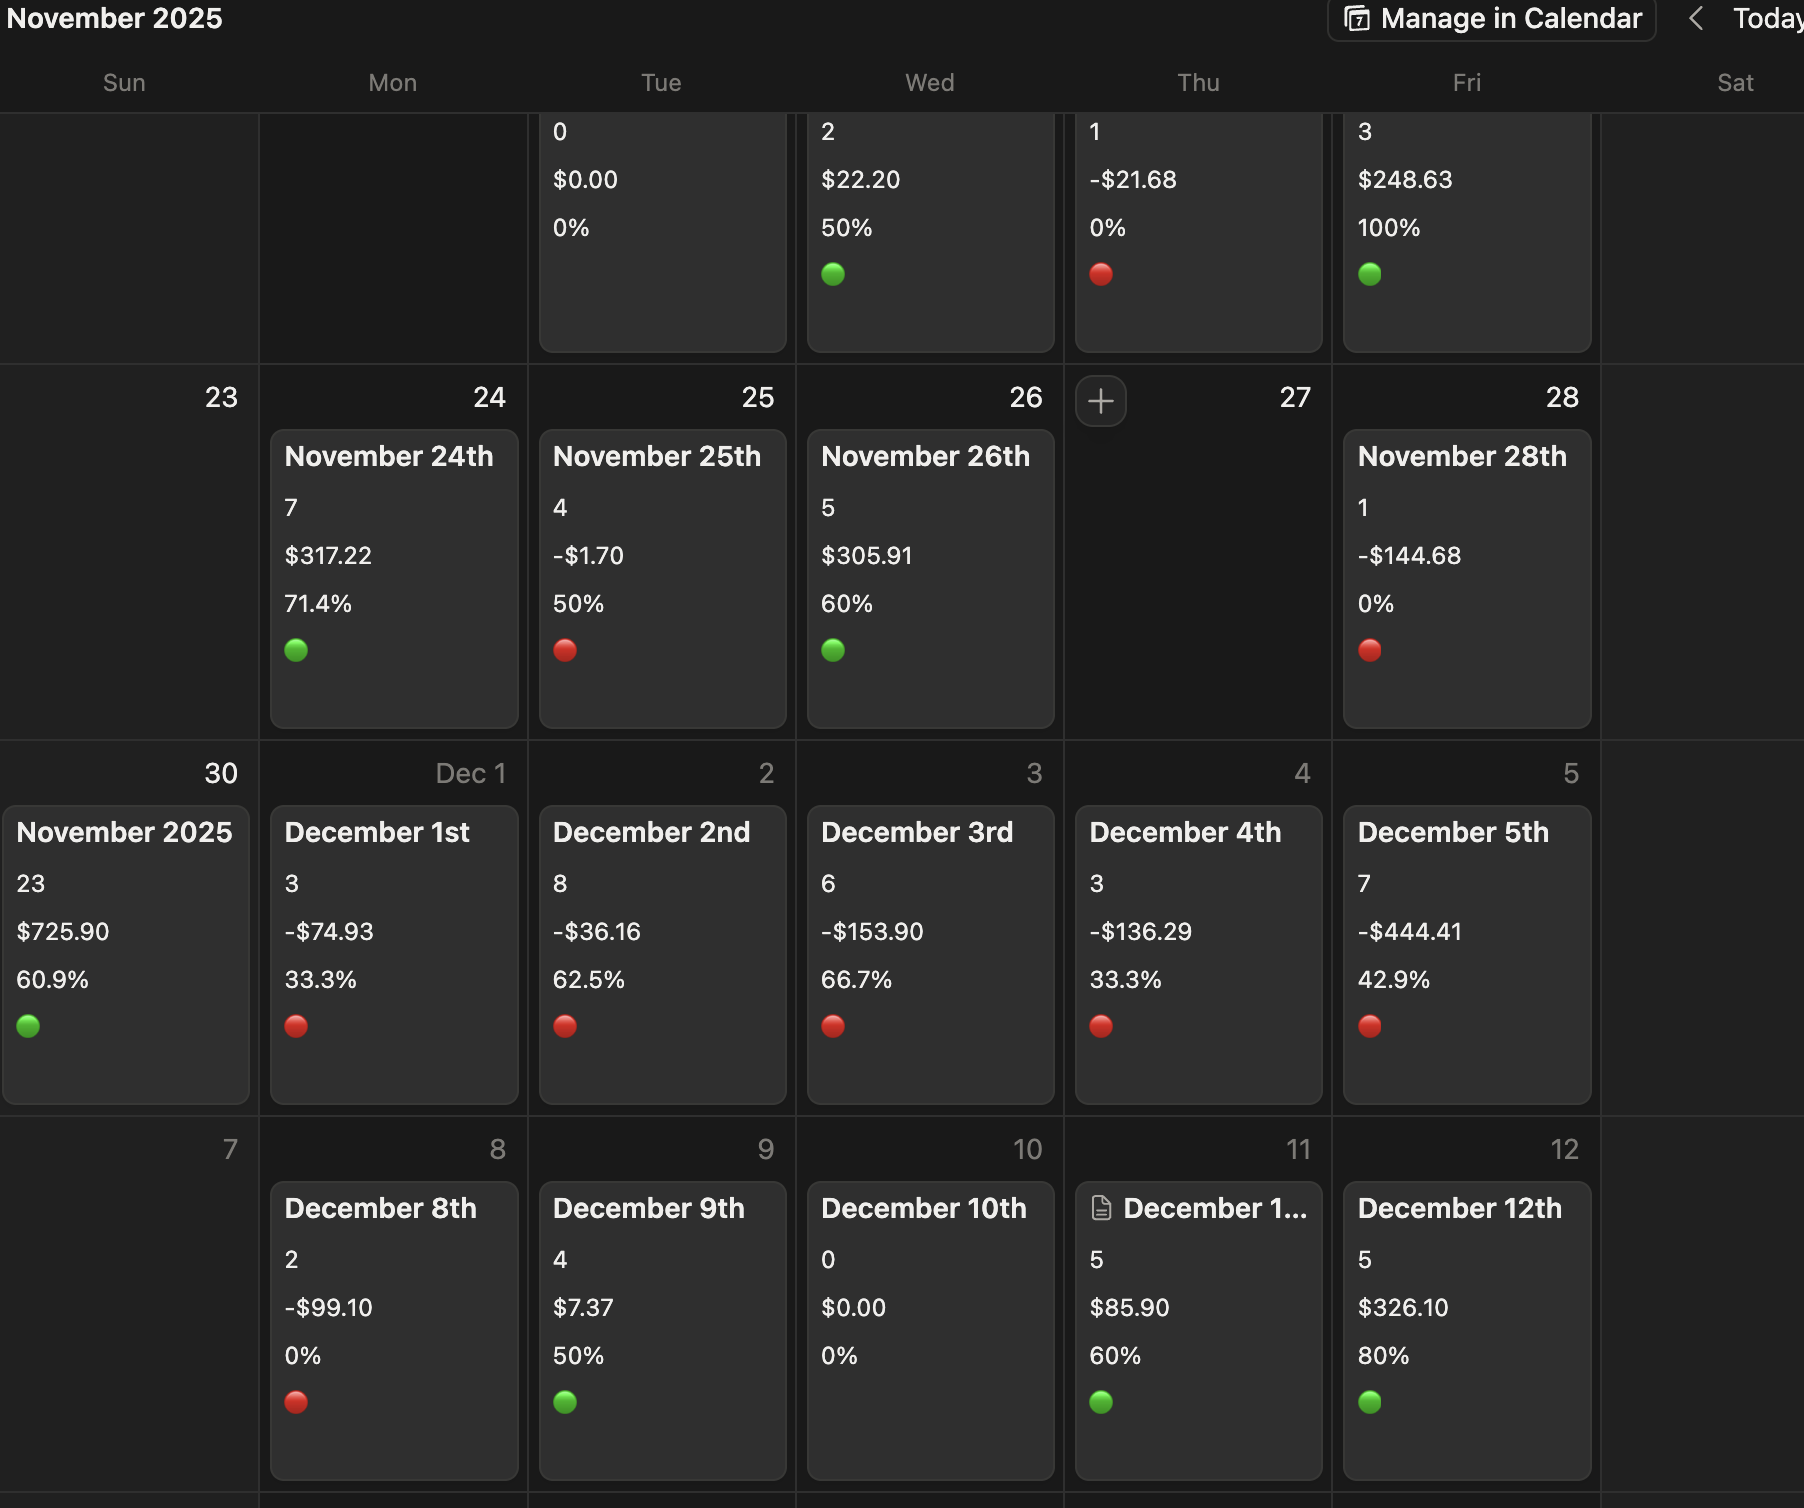
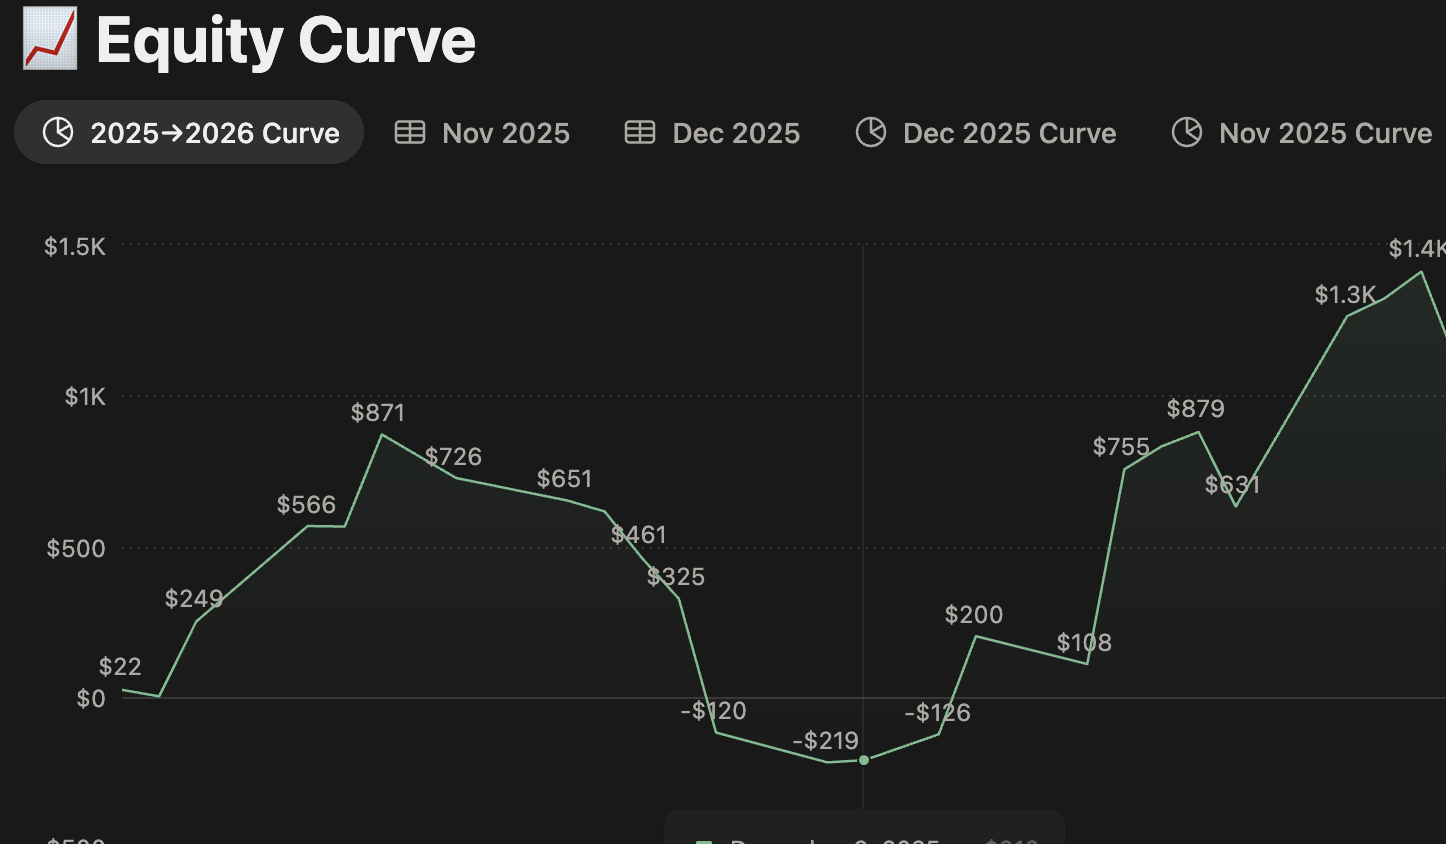
Trading Performance Calendar & Equity Curve

Trading Performance Analyst For All Tags

Simple and Easy to Use!